Converting ITSI Glass tables to Splunk Dashboard studio
Most of the functionality of ITSI glass tables is now available in Dashboard Studio. The advantage is that you can use dashboards created with Dashboard Studio outside ITSI in your own apps and you can expand your dashboards with “save as > Existing Dashboard” from Search.
What is different in a glass table? The order of the “objects”
You can view the json source code of your Glass Table when editting and json with “show source”
You can collapse the "parent objects" such as "dataSources" in the json browser. If you fold all the parent objects and compare them with dashboard studio, you will see that the order is different.
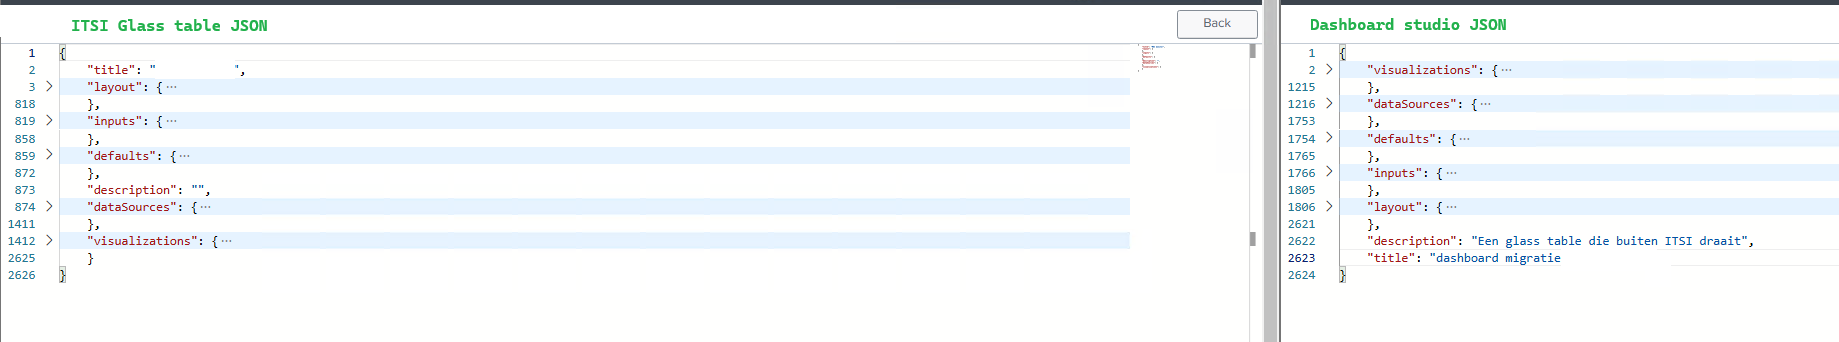
Comparison between ITSI glass tables and Dashboard Studio json
The left order of the parent objects is how ITSI glass tables objects JSON are structured , the right is how they are structured in Dashboard Studio
Tip: Use an IDE like VSCode with a json (lint) extension so you can see if there are syntax errors or other problems in your Dashboard Studio json code.
Migrating ITSI GlassTables to Splunk Dashboard Studio
The first thing you have to do is open your ITSI glass table and click “show JSON”.
Create a new dashboard in a different browser tab or window in create dashboard studio with an “absolute” layout.
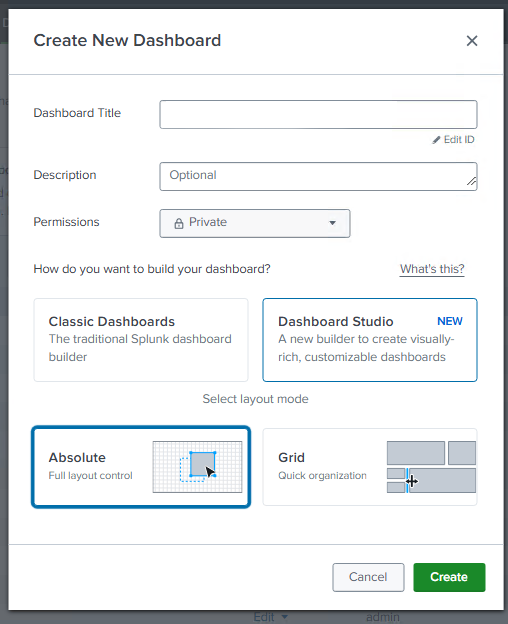
Create a new dashboard with an “absolute” layout
Transfer one thing at a time and click save
To avoid error messages, you should not transfer everything at once but one parent object at a time. Start at visualizations, save and try clicking save with each new object you transfer. Sometimes saving doesn't work because of an error message, but at least this way you most likely have one or more objects like datasources converted to dashboard studio. Use an IDE to check for syntax errors (such as missing or wrong commas and curly braces)
Optional: Convert queries from ITSI to a general query.
If all goes well, you now have a working dashboard, but it still depends on ITSI KPIs. If you want to make them independent of ITSI, they still need to be converted. If you look at the "data sources" in Dashboard Studio, you will see a hard reference to ITSI KPIs and services:
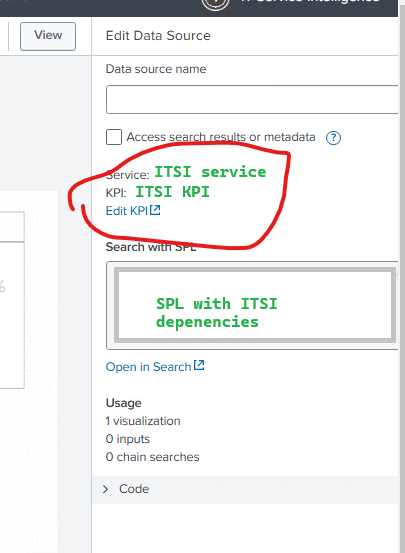
Open the KPI and copy the source “search query”. Look at the "calculation" to see what kind of stats command you’ll need. For example: you can convert the following via | stats dc(group-by field)
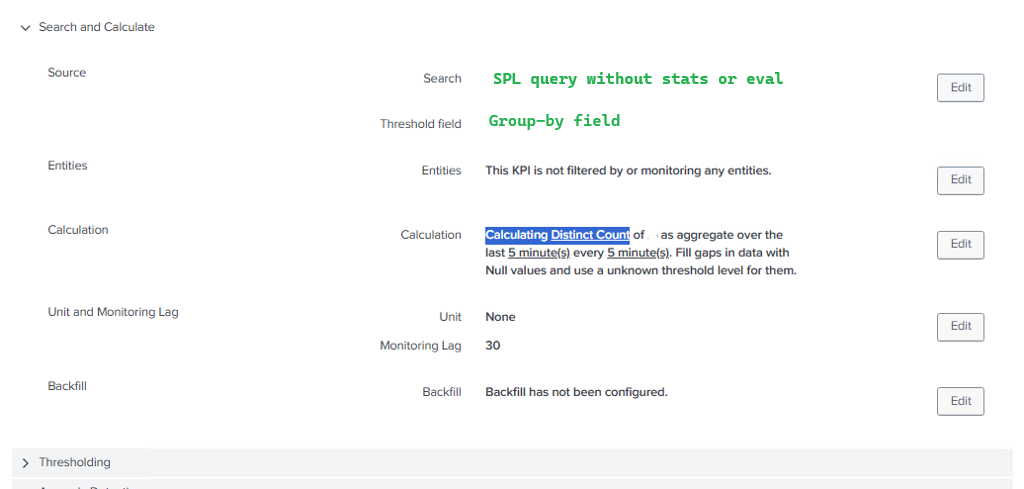
The old SPL is based on values from ITSI's services or KPIs.
Conclusie:
Converting GlassTables to Dashboard Studio is very simple, the main difference is the order of the JSON objects.